Race material for WorldTour races
Our goal is to create tools that can help fans, journalist and teams, understand the sport we love better.
Sections and tools
For each race we have created the following sections, to give you insights about the race and the climbs.
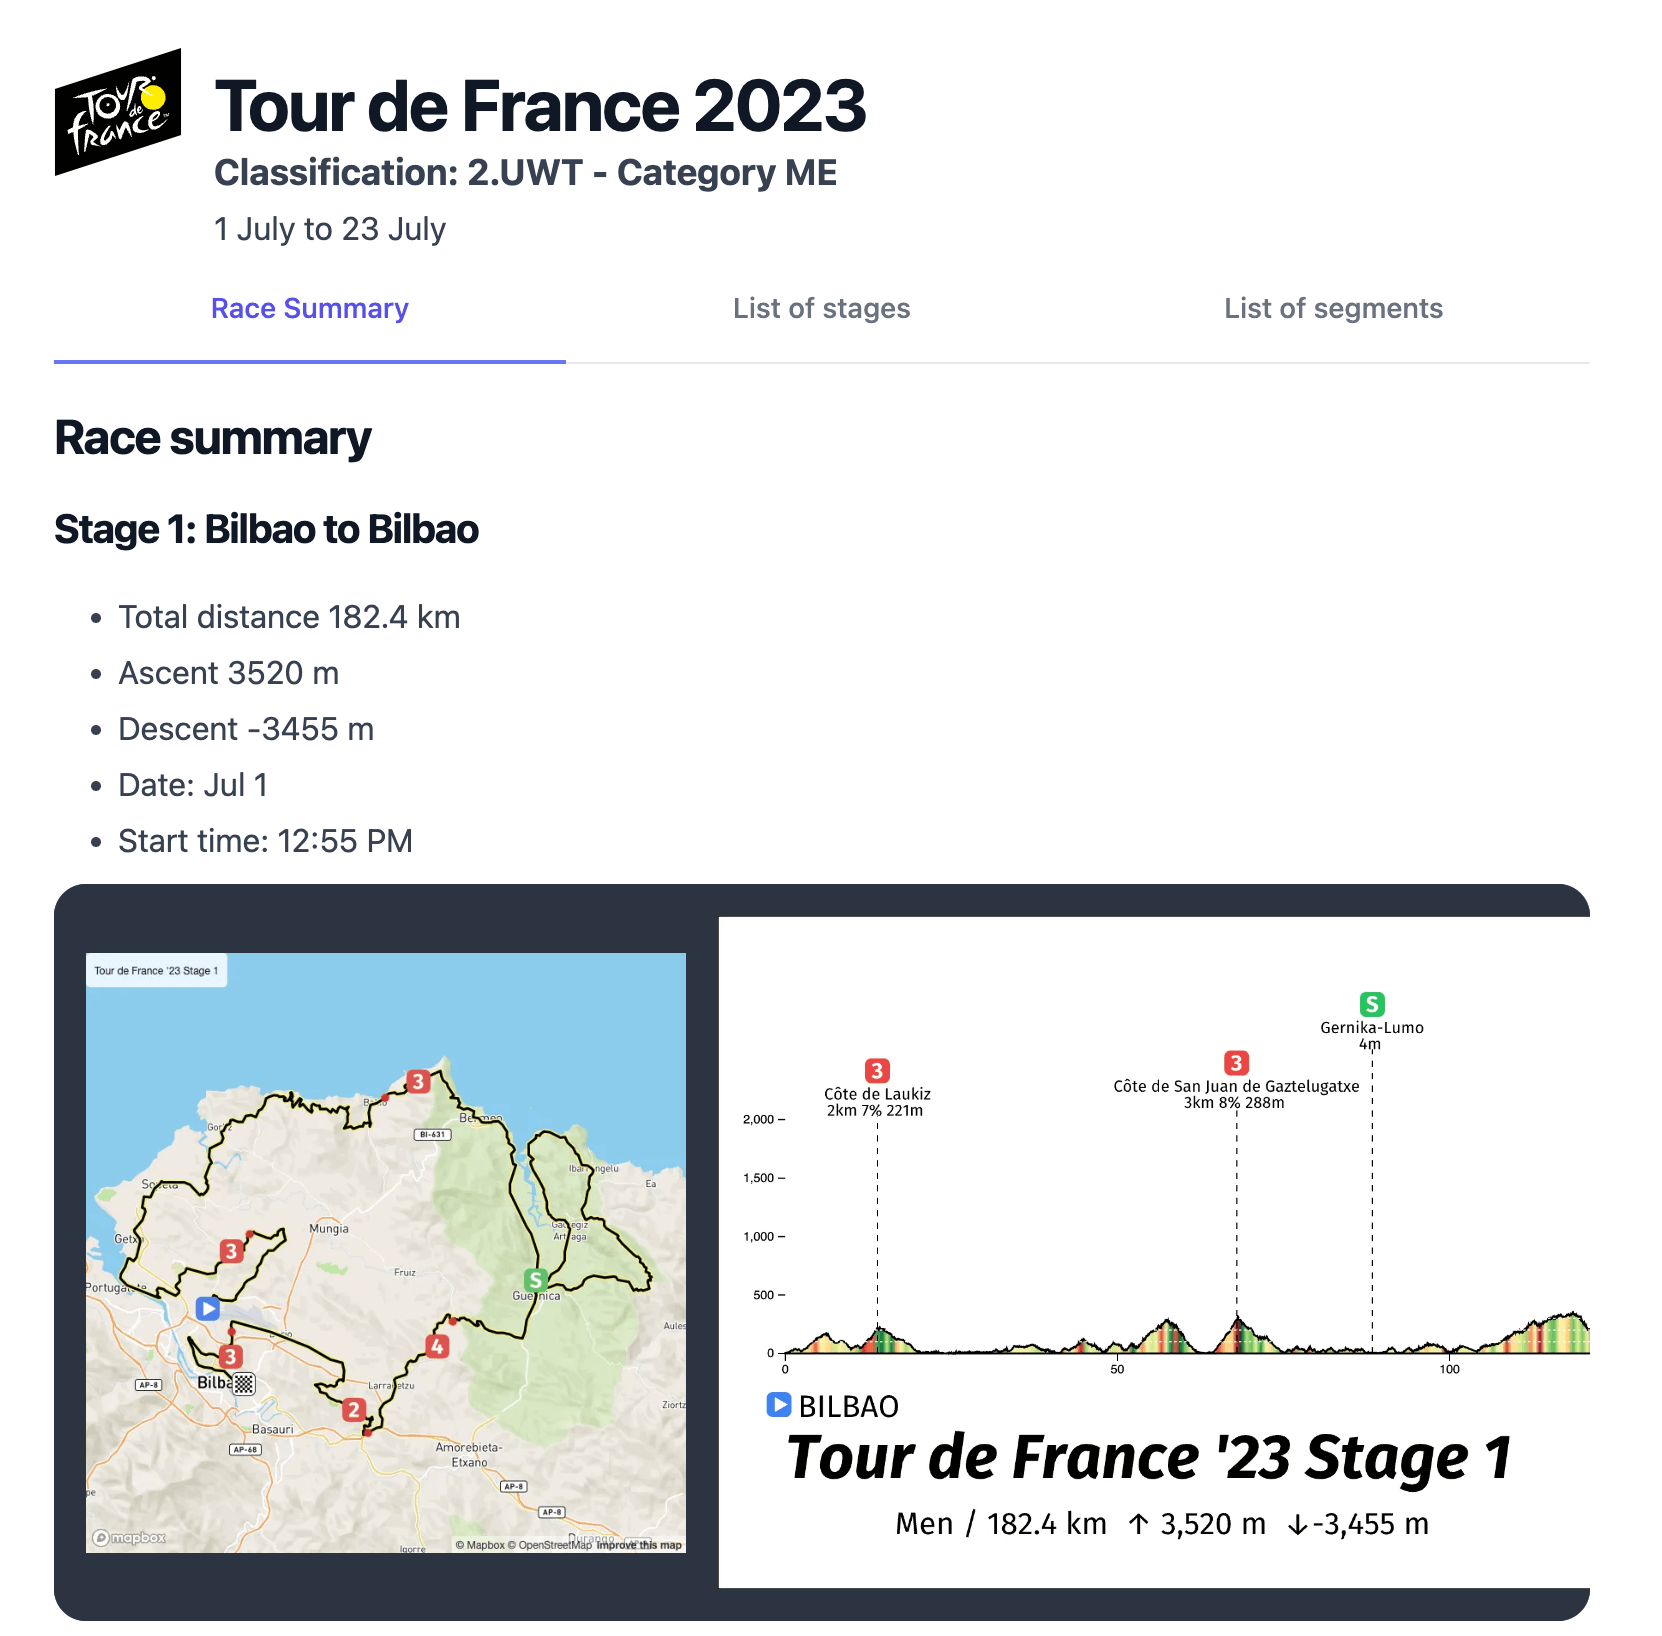
Race summary
For each stage race and one-day race, we create a summary with maps, videos and profile of the routes, as well as a list with all the climbs. This gives a great overview of the whole race.
See an example here.
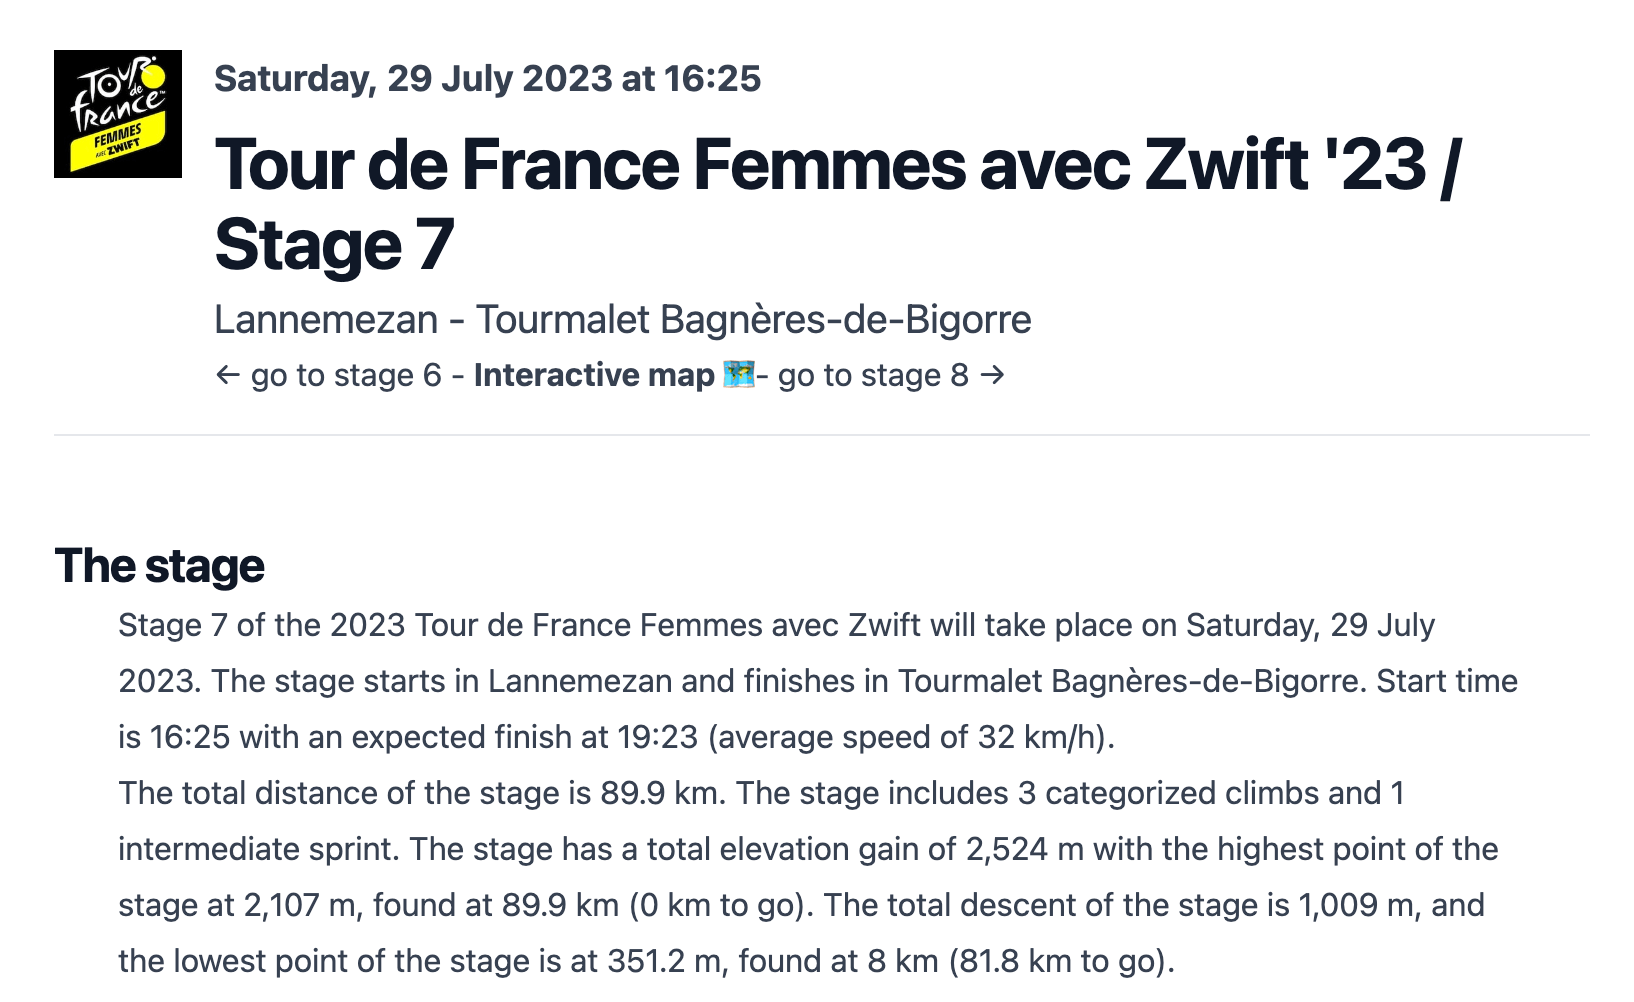
Stage summary
For each stage in a stage race, we create a summary of the stage with maps, videos and profile of the routes, as well as weather predictions for the the whole route, at the estimated time the peloton will be there. We also have maps, videos and profiles for all climbs and final 3 km of the stage.
See an example here.
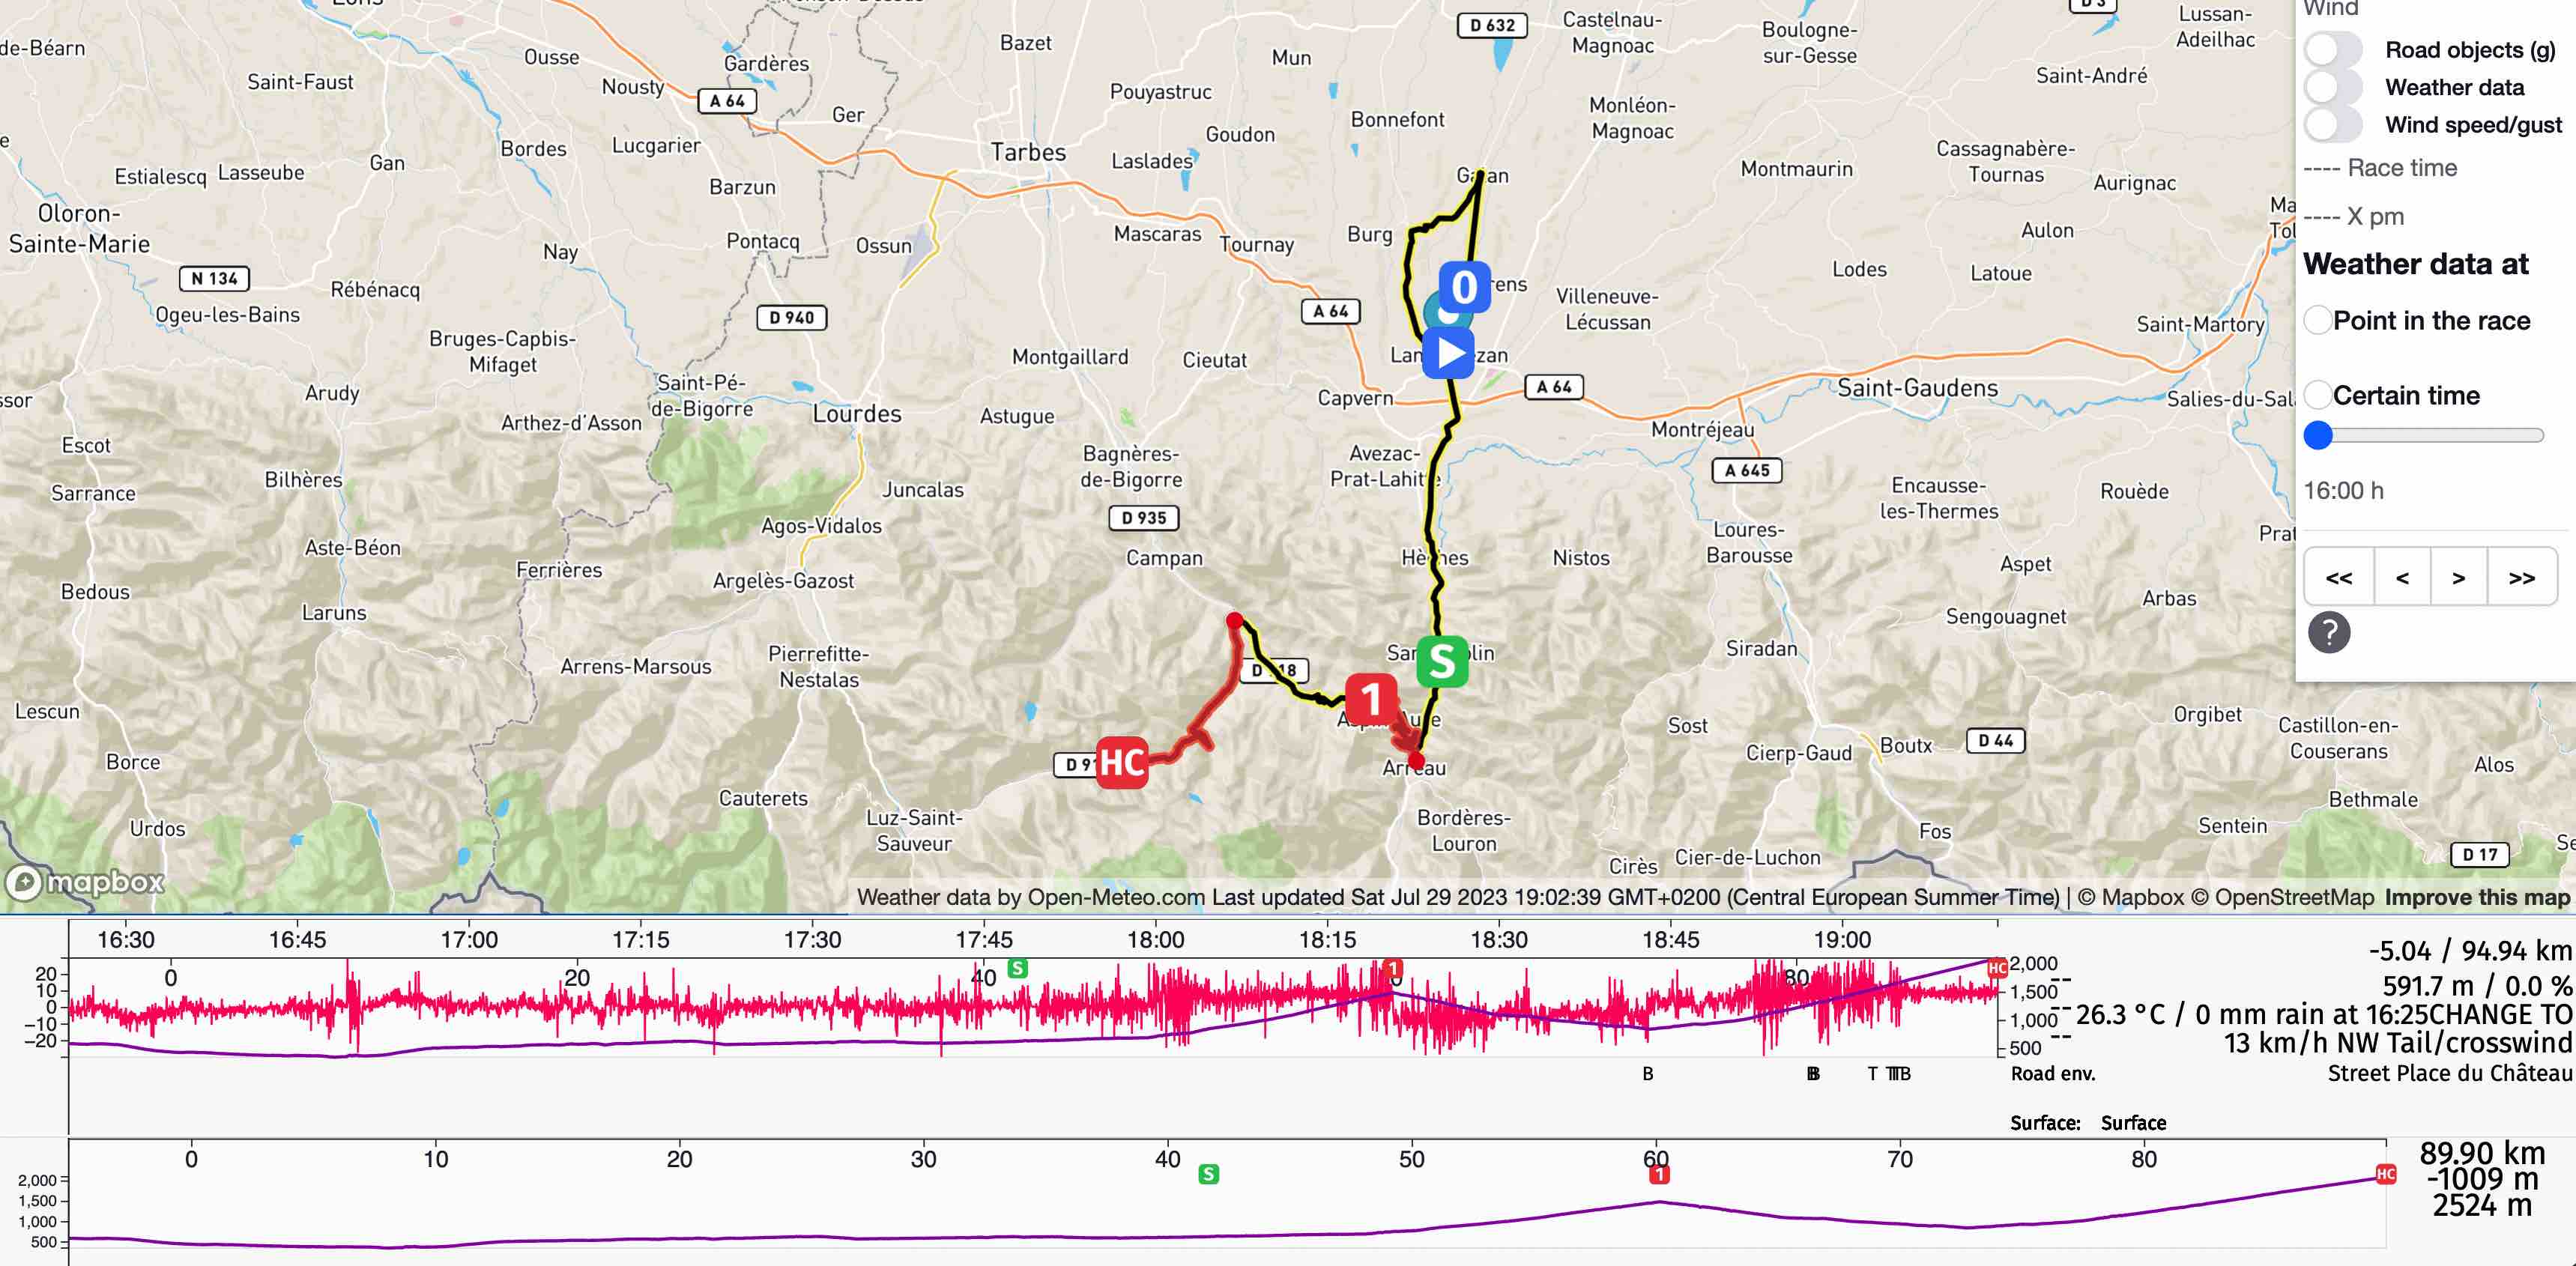
Interactive Roadbook
We have developed an interactive roadbook, where you can deep dive on the route, focus on segments, climbs, final 3 km, etc. You can also see the weather predictions for the whole route, at the estimated time the peloton will be there. We have also integrated a smooth Street View option
See an example here.
Segment analysis
Maps and elevation profiles for any segment you choose, this gives you the option to deep dive on specific mountain passes, cobbled sections, etc.
See an example here.
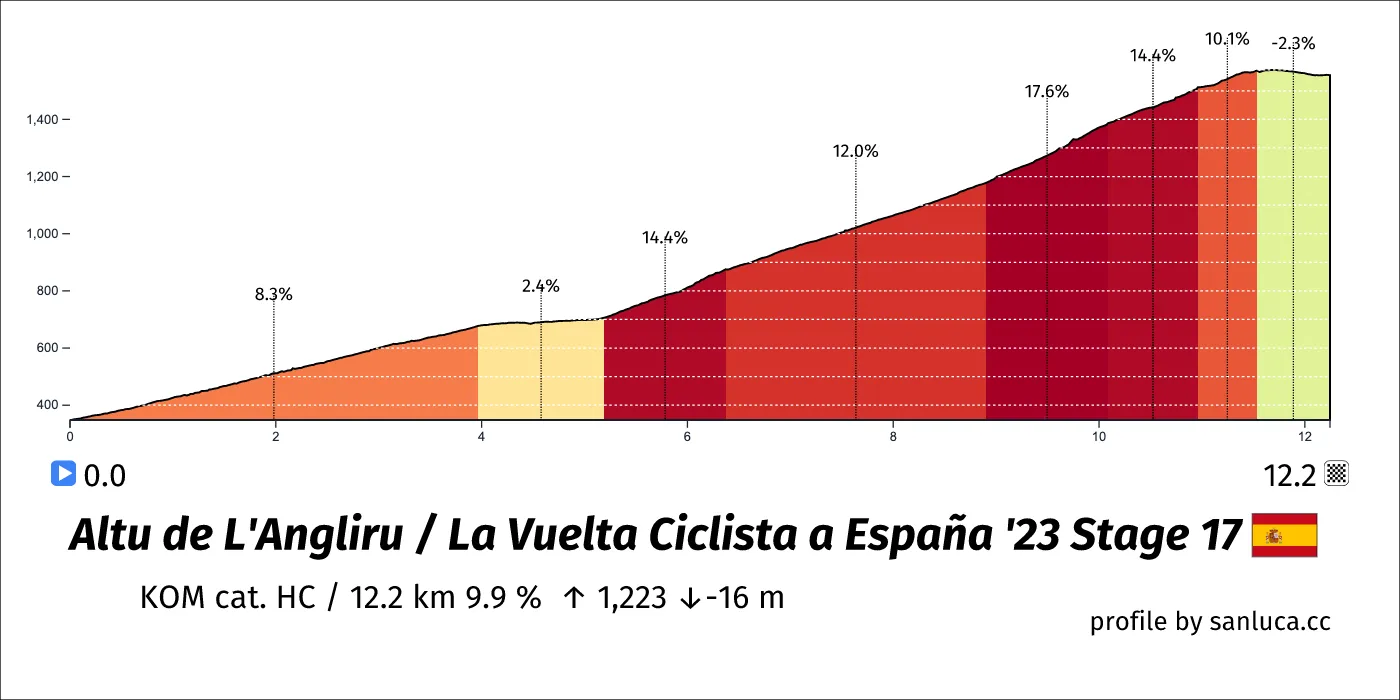
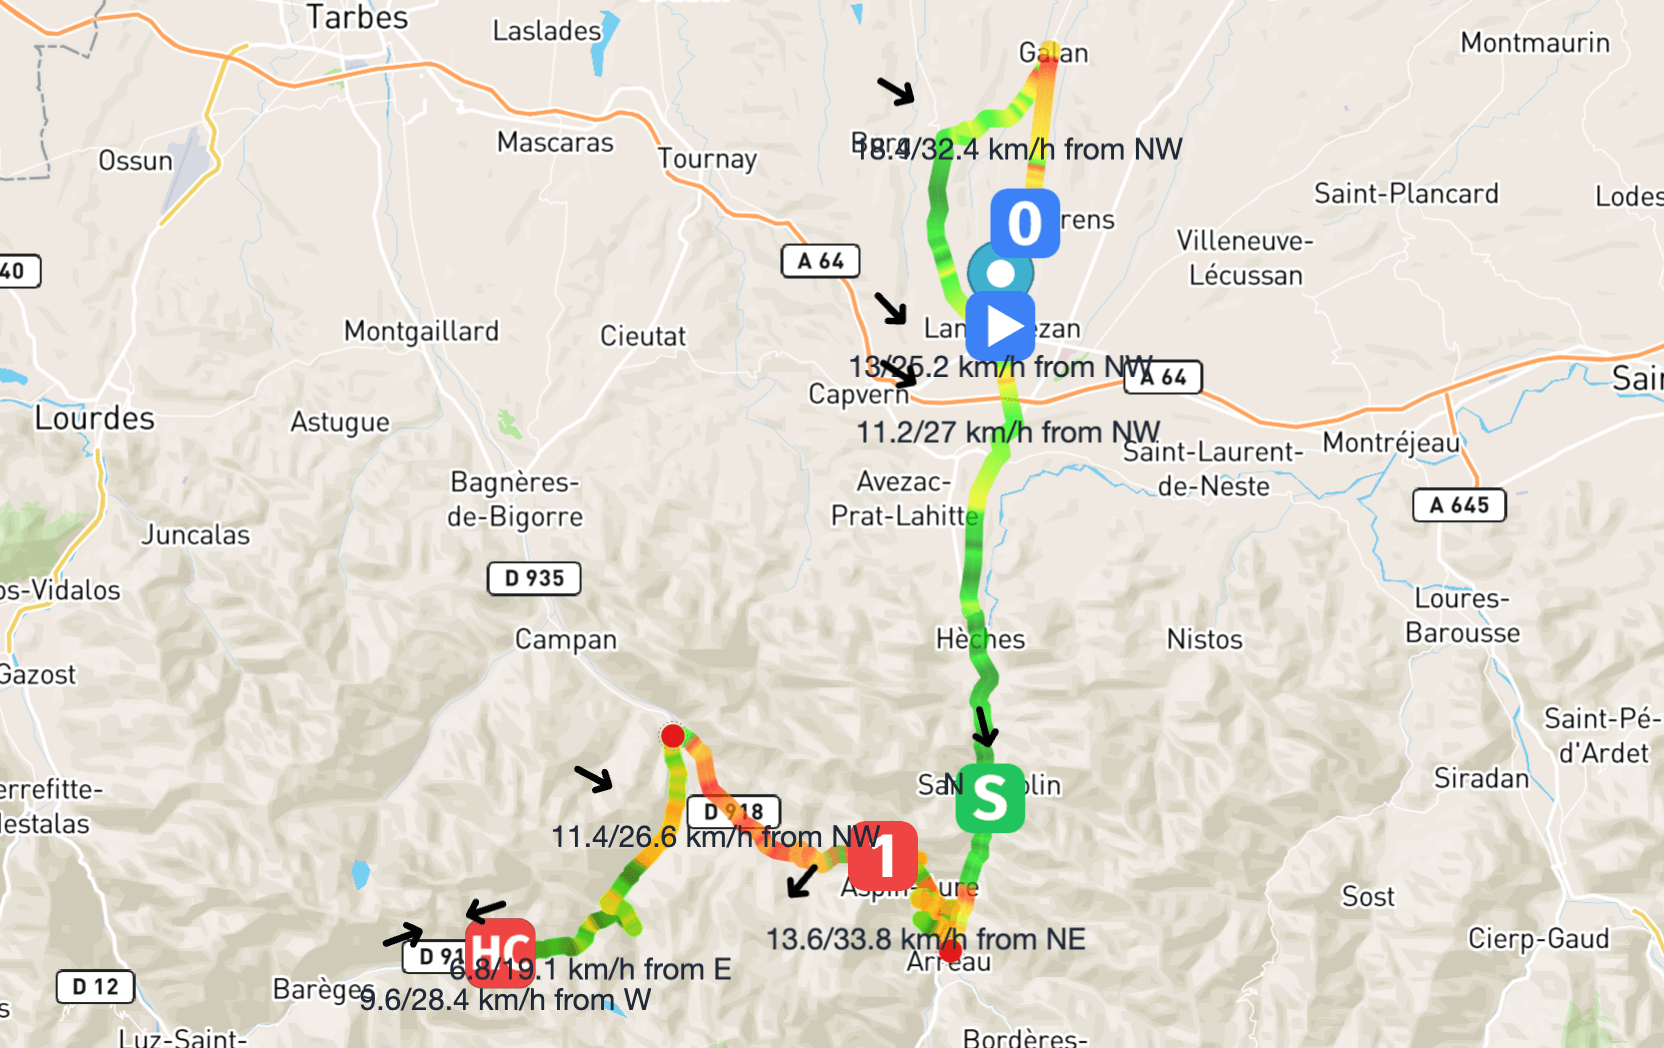
Weather data
We have integrated weather data for all our routes, so you can see the weather predictions for the whole route, at the estimated time the peloton will be there.
See an example here.
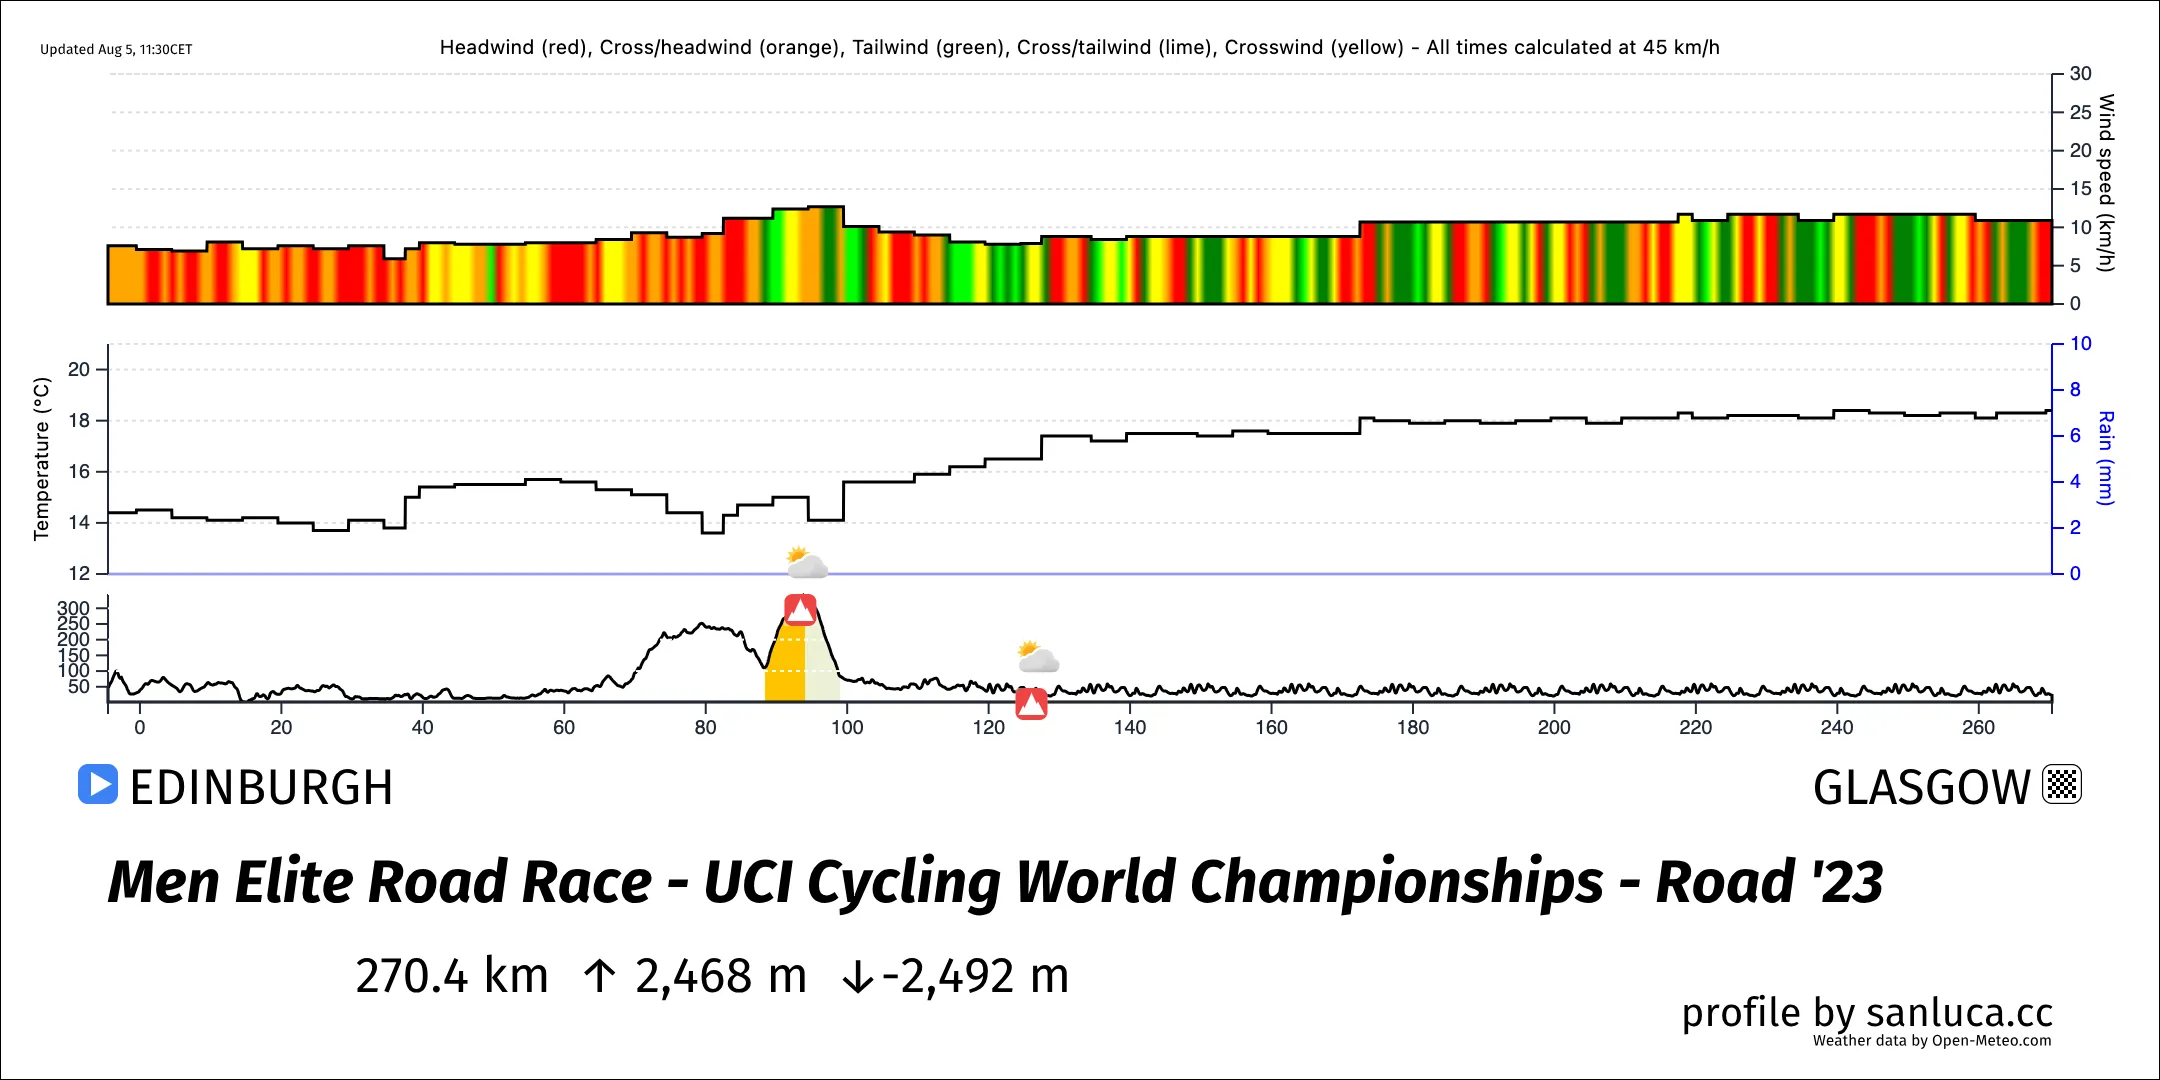
Headwind, tailwind or crosswind?
On our map, you can activate the wind option and see on the map where the wind is coming from, both with arrows and colors. This gives you a great overview of the wind situation for the whole route.
